Saturday, April 27, 2024
Fair and Windy, 68°Wind: 26.5 mph, W

Welcome to our new web site!
To give our readers a chance to experience all that our new website has to offer, we have made all content freely avaiable, through October 1, 2018.
During this time, print and digital subscribers will not need to log in to view our stories or e-editions.

Lyft's second annual Year in Review looks at anonymous, aggregated rideshare data to understand the trends that defined our year. Here's where Americans ate, shopped, and had fun in 2023.
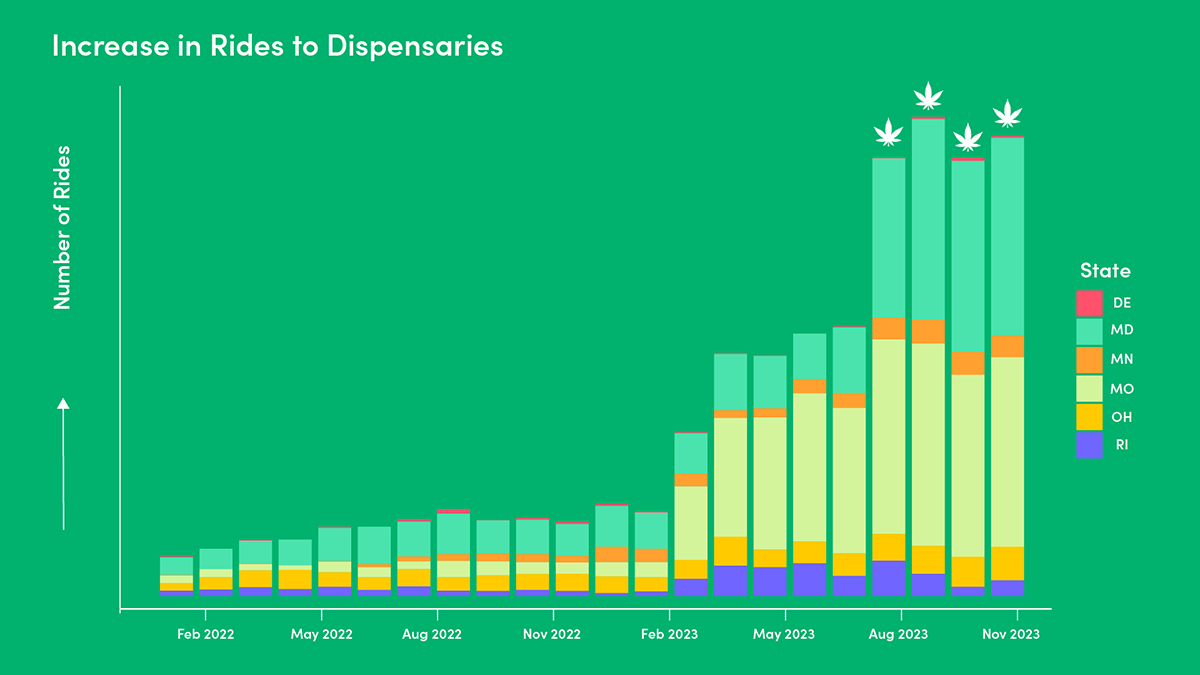
Over the past two years, recreational cannabis was legalized in Delaware, Kentucky, Maryland, Minnesota, Mississippi, Missouri, Ohio, and Rhode Island, which may help explain why dispensaries were the fastest-growing drop-off category in 2023, jumping 366% overall. Of these states' residents, Marylanders and Missourians seemed particularly enthusiastic; dispensary visits shot up in those places by around 500% last year.
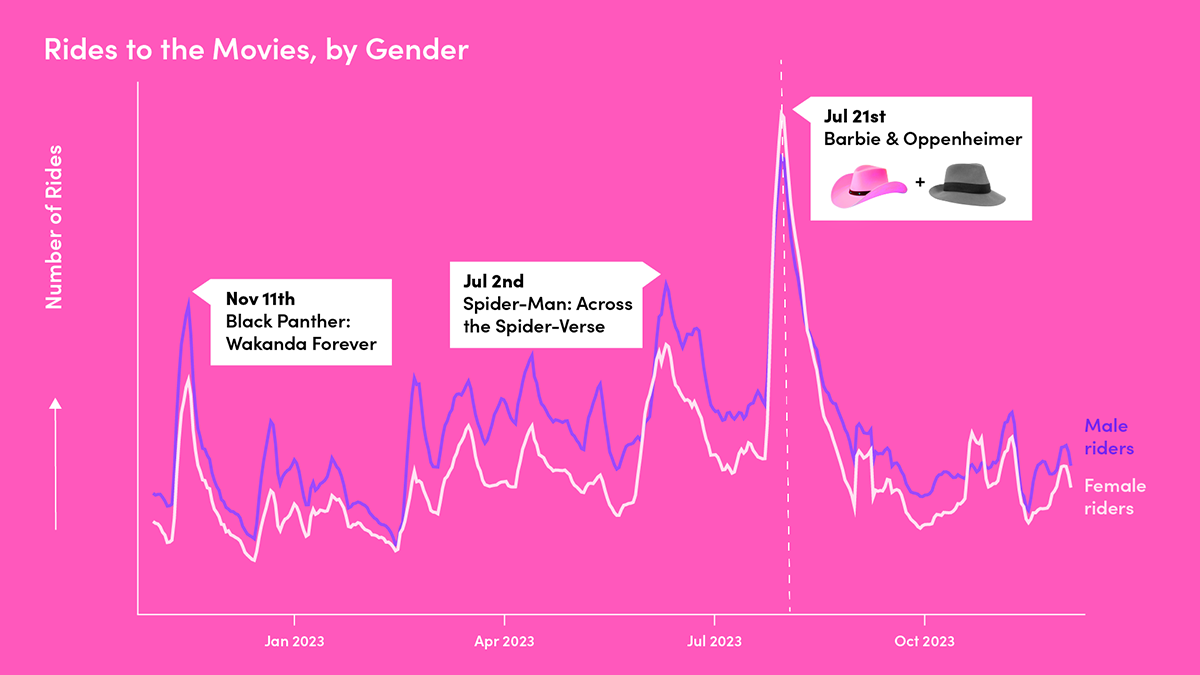
It is no secret that the same-day release of "Barbie" and "Oppenheimer" was a boon for the movie business, contributing to a 45% jump in cinema drop-offs this year. Lyft data also suggests an interesting gender breakdown. While male riders typically go to the cinema more frequently (and particularly during the release of Marvel movies like "Black Panther: Wakanda Forever" and "Spider-Man: Across the Spider-Verse"), female riders outpaced males on the July 21 weekend and again in mid-October — when "Barbie" and "Taylor Swift: The Eras Tour" were released, respectively.
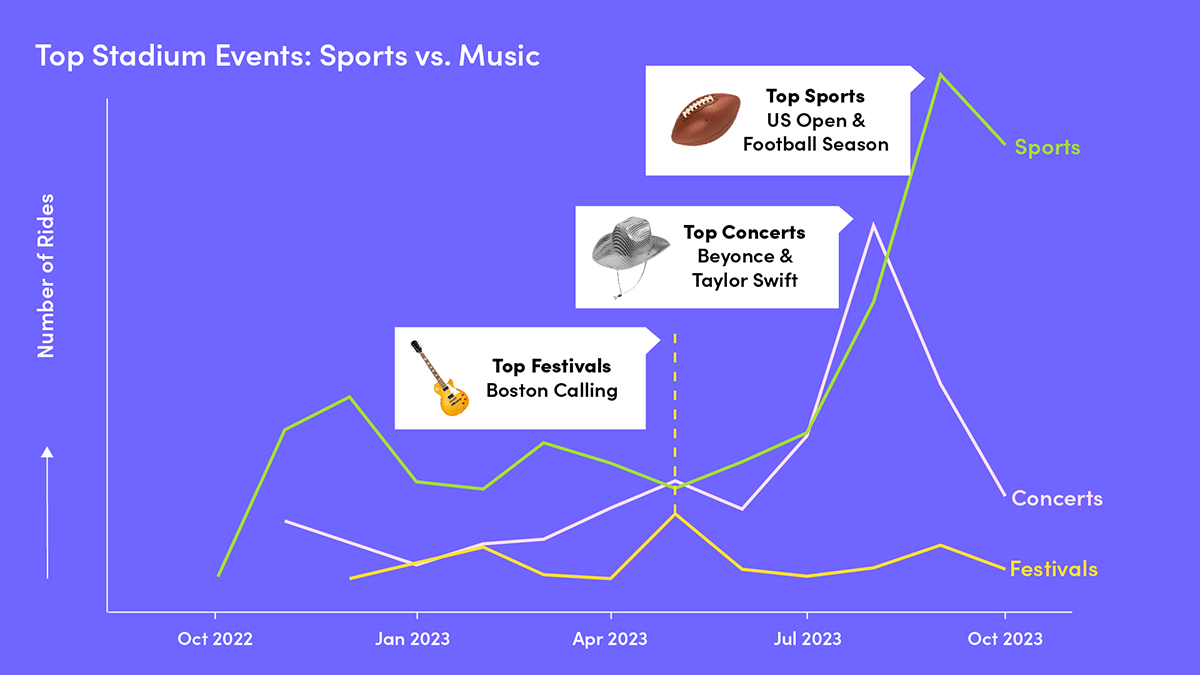
Stadium visits grew 37% this year — but not just for sports. In May and August, concerts drew more fans than games. Much of this rise can be chalked up to two artists: Taylor Swift, who drew 16% of all stadium rides in May, and Beyoncé, who drew 23% of the stadium rides in August for her Renaissance World Tour. Come September, sports rebounded: The US Open drew 9% of stadium rides in September, and the Philadelphia Eagles vs. Los Angeles Rams football game attracted 3% of all stadium rides in October.
And then there was the time in 2023 when football and music unexpectedly crossed over. On September 24, musician Taylor Swift attended a Kansas City Chiefs football game, following rumors that she might be dating the Chiefs' tight end, Travis Kelce. Since then, the Chiefs have seen a 200% increase in attendance by Lyft-riding Swifties (i.e., Lyft riders who also attended a Taylor Swift Eras Tour concert).
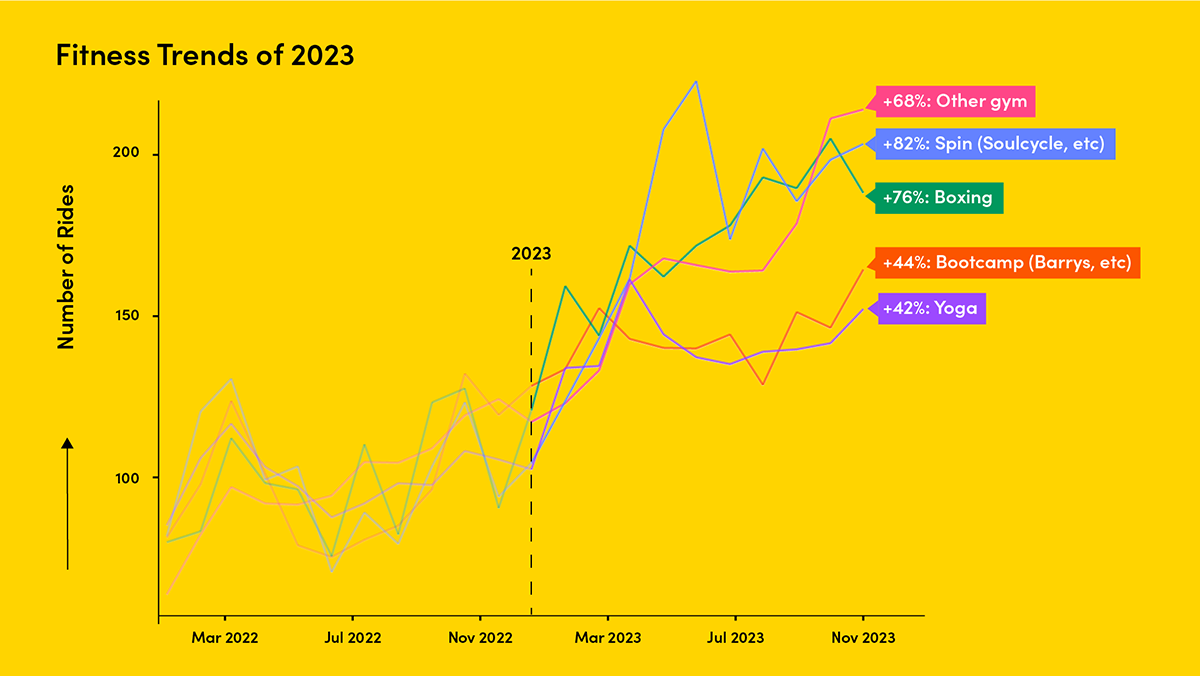
Rides to gyms were up 68% this year. And what were the hottest fitness trends of 2023, according to our data? Boxing and spin, where rides to those classes increased by 76% and 82%, respectively.
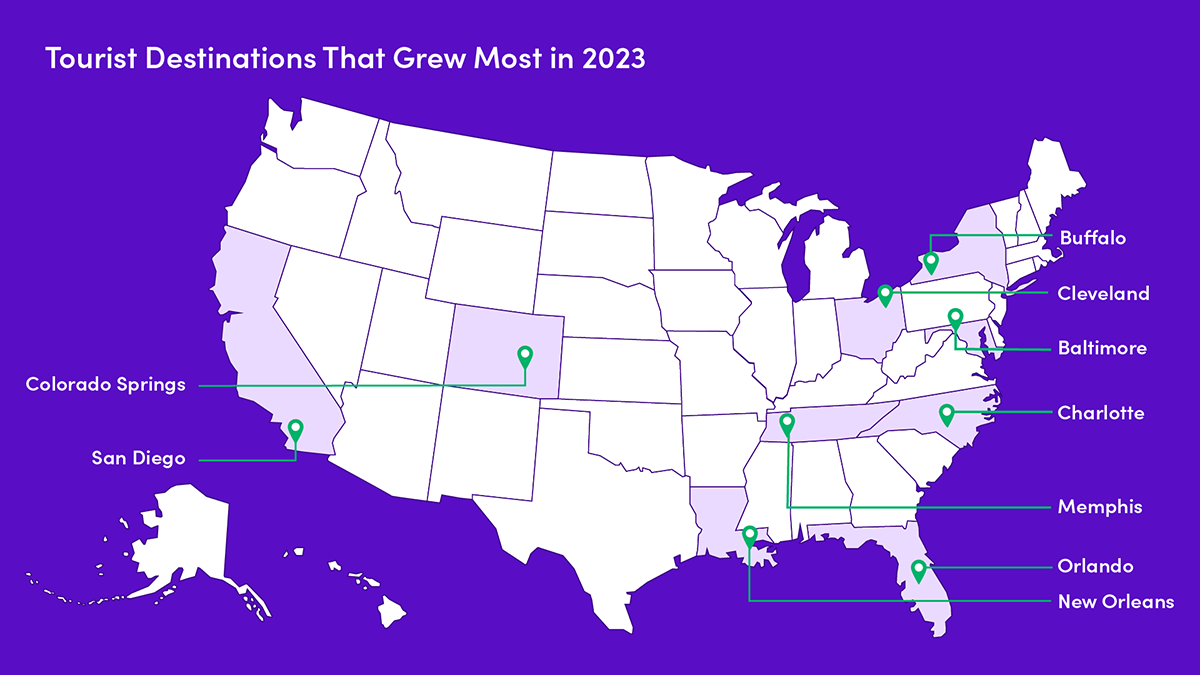
Rides to tourist destinations increased 47% overall — but not uniformly. The rise was led by Memphis, Tennessee, where tourist activity doubled (178% increase). Much of this growth comes from visits to Graceland, perhaps sparked by last year's Oscar-nominated Elvis biopic?
Other top-growing tourist destinations of 2023 included Colorado Springs, Colorado (+156%), Orlando, Florida (+152%), and Baltimore, Maryland (+135%).
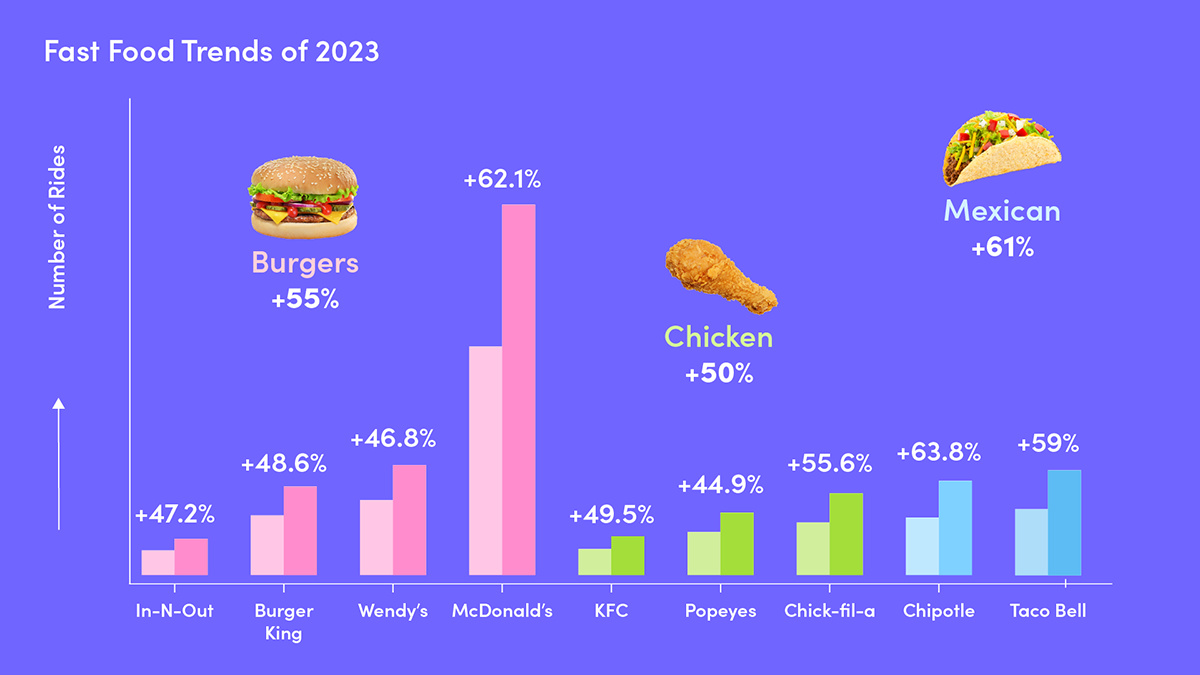
On aggregate, fast food drop-offs grew 40% this year. McDonald's increased its dominance, while Mexican food was the fastest-growing cuisine, with Taco Bell and Chipotle drop-offs growing roughly 60%. Rides to chicken and burger spots were close behind — increasing roughly 50% and 55%.
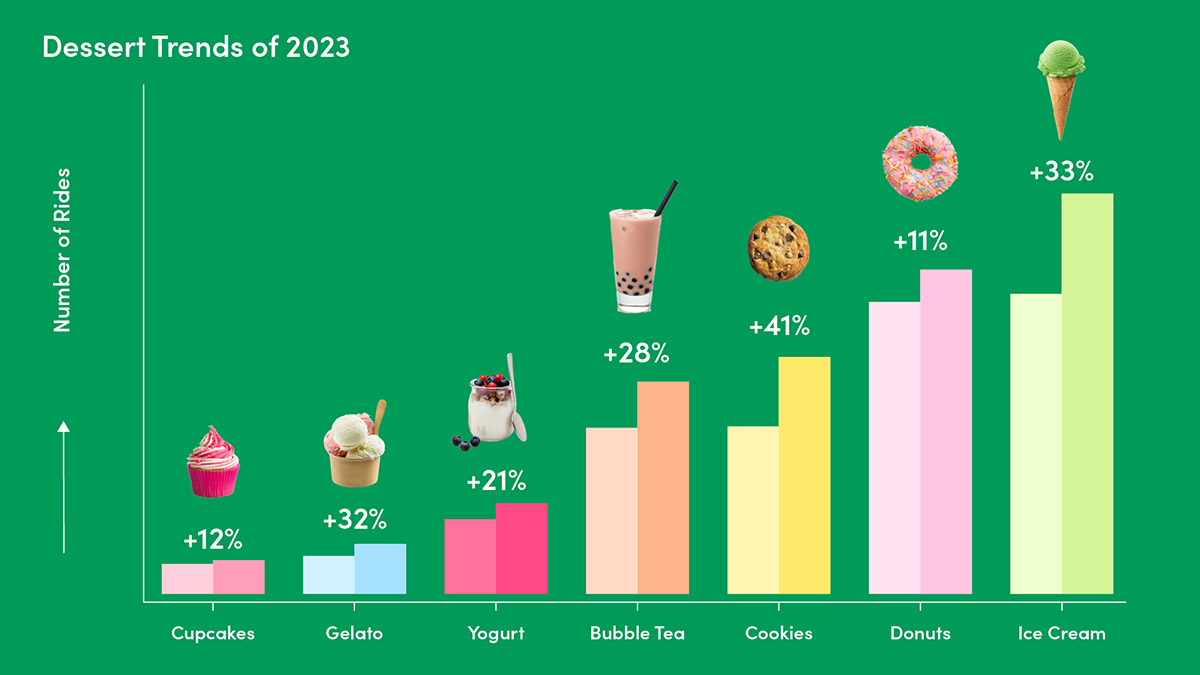
Lyft data suggests we got even sweeter this year, as rides to dessert destinations were up 37%. While donuts and ice cream remained the most popular options, the fastest-growing category was cookies, driven mainly by rides to Insomnia Cookies.
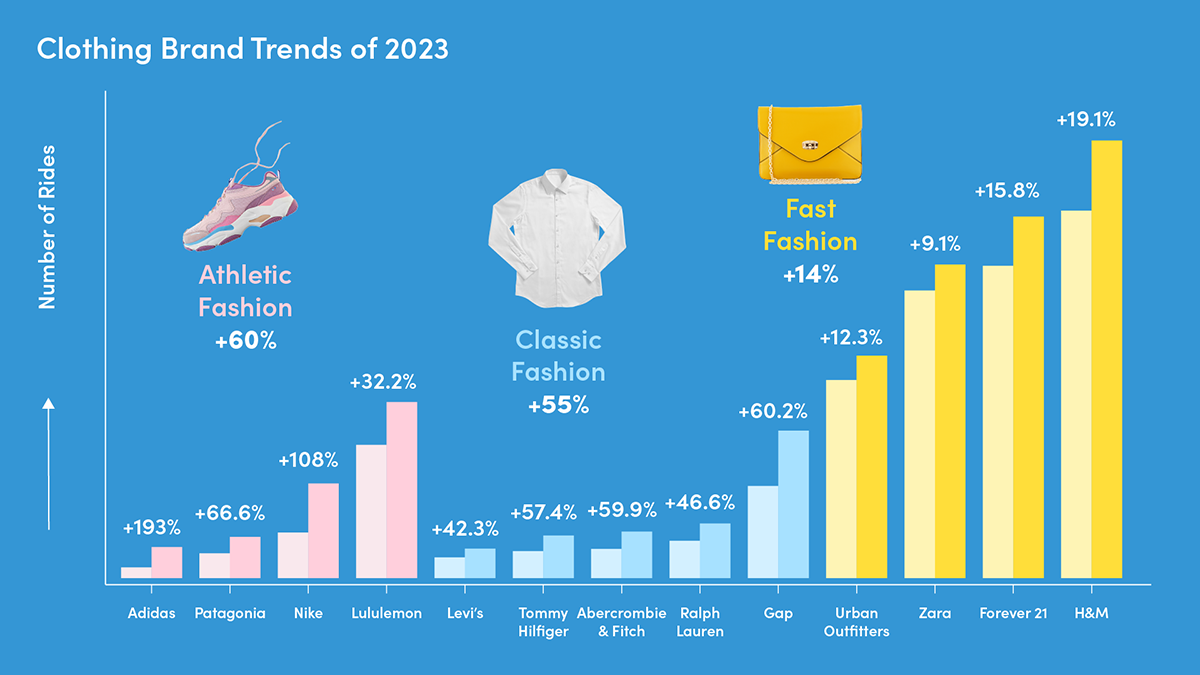
According to our data, athletic wear and sneakers were on a tear, increasing an average of 60%, and classic American brands had a resurgence in 2023, growing an average of 55%. Visits to malls, meanwhile, dropped 10%.
This story was produced by Lyft and reviewed and distributed by Stacker Media.


